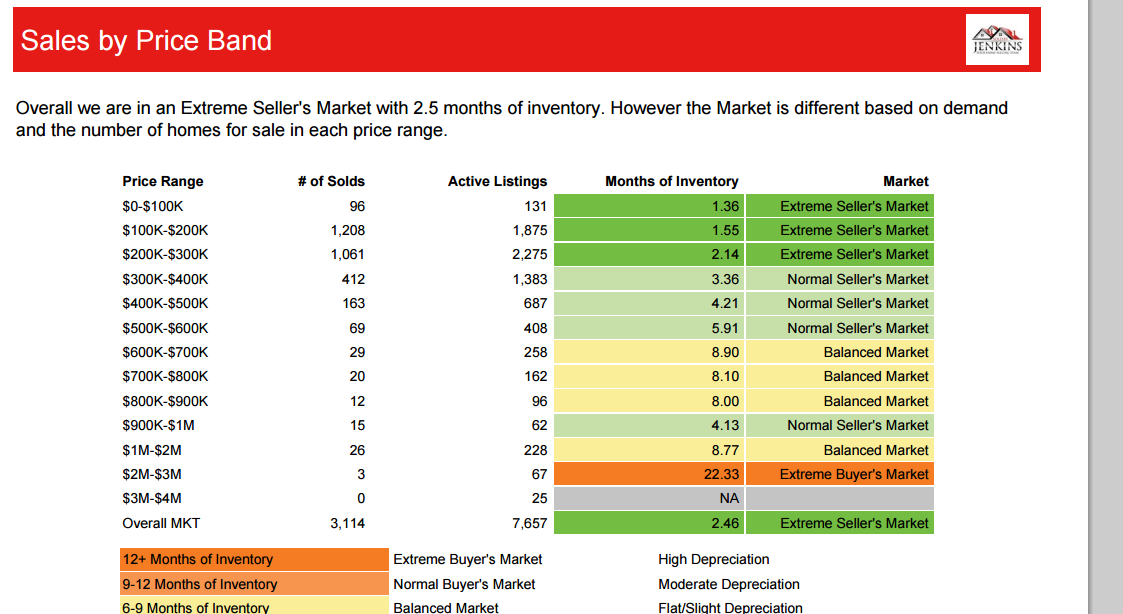
Overall in Las Vegas and Henderson, Nevada real estate, we are in what is considered A Extreme Seller’s Market. While the real estate climate can fluctuate and change with financial and statistical trends, Las Vegas has seen a great amount of growth. 2.5 months of inventory exhibits the seller’s market data, even though the market can be different based on demand and the quantity of homes for sale in each price range. Homes have sold most from the 200-300K price range
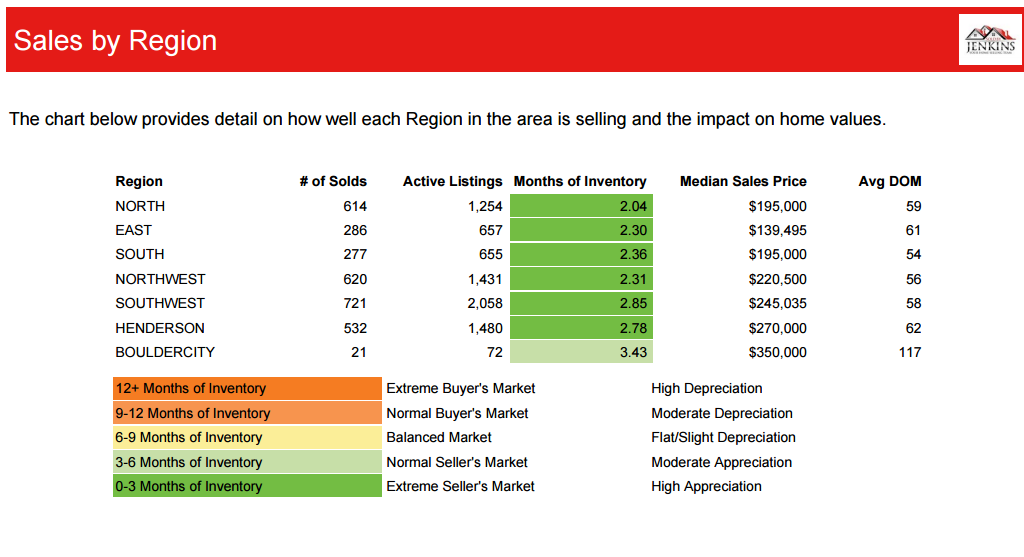
In North Las Vegas, 485 homes sold with 2.04 months of inventory, at a median sales price of $195,000. Contrastingly, in Boulder City, Nevada, there were 21 homes sold with 3.43 months of inventory- the average selling price here was $270,000. High levels of home sales in the Southwest show 721 home sales at a median price of $245.036 after 2.85 months of inventory. These figures have changed over a period of time. he different regions in Las Vegas sell at varying speeds- some of these statistics can impact the value of homes for sale in Las Vegas and Henderson, Nevada.
Although there have been some slight variances. Home prices seem to fluctuate. In a Extreme Seller’s Market, 0-3 months of inventory is the norm, with moderate appreciation. Normal Buyer’s markets see 9-12 months for inventory sales, with moderate depreciation. A balanced market generally falls somewhere in between at 7-8 months of inventory, with slight depreciation of properties.
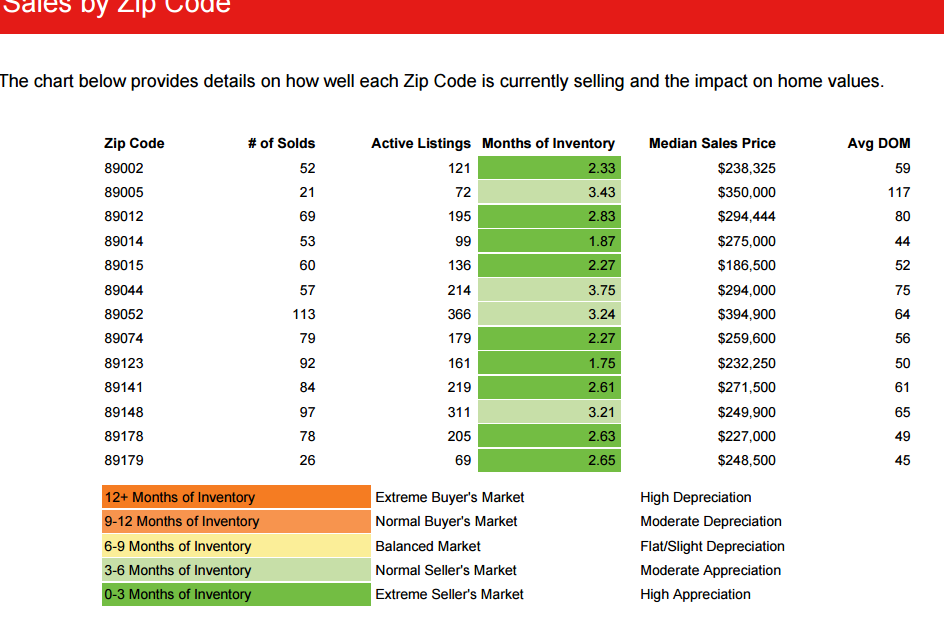
In the current Normal Seller’s market climate, zip codes in and around the Las Vegas area can be an implication as to what areas are experiencing the most home sales. 89052 (Henderson, NV) saw 113 homes sold at a median price of $394.900. 89178 came in with 78 homes sold at a median sales price of $227,000. The 89005 zip code (Boulder City, NV) showed 21 homes sold at a median sales price of 350,000. On the whole, the rise in home prices has paused.